
Forecasting COVID-19 using Logistic Regression: Sigmoid-Fitting

“In response to the COVID-19 pandemic, the White House and a coalition of leading research groups have prepared the COVID-19 Open Research Dataset (CORD-19). CORD-19 is a resource of over 45,000 scholarly articles, including over 33,000 with full text, about COVID-19, SARS-CoV-2, and related coronaviruses. This freely available dataset is provided to the global research community to apply recent advances in natural language processing and other AI techniques to generate new insights in support of the ongoing fight against this infectious disease. There is a growing urgency for these approaches because of the rapid acceleration in new coronavirus literature, making it difficult for the medical research community to keep up.”
The data is available here:
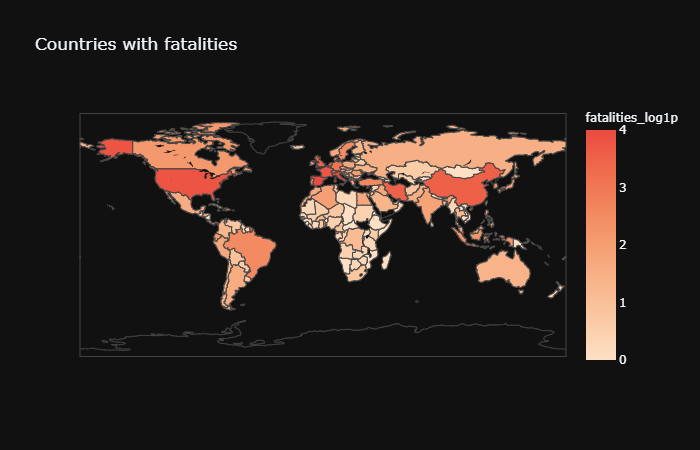
Worldwide Trend
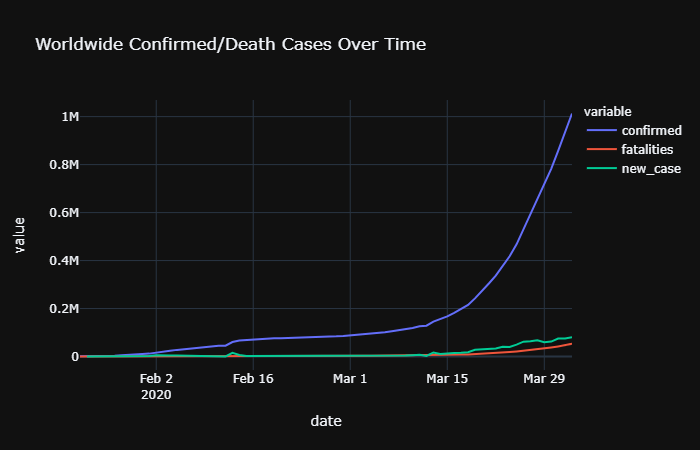
Clearly, we have exponential growth. Let’s use a log-scale so we can see the growth of the growth rate.
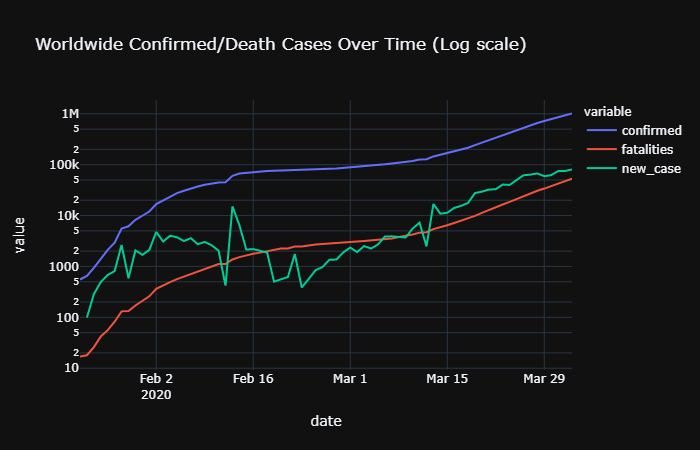
See there is a slight increase from the beginning of March to the end of March. Despite the lockdown policy in Europe and the US, the number is still increasing. Also, the fatalities curve seems to just be a shift of the curve for confirmed cases meaning that mortality rate is almost constant.
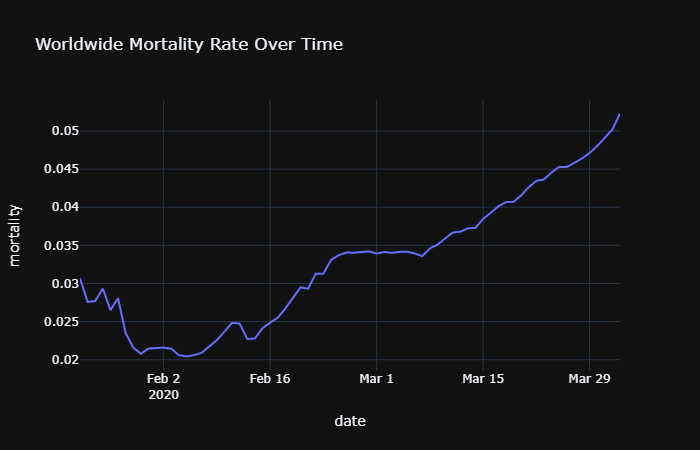
However, upon scrutiny, we see that the mortality rate has been increasing from 3% to almost 5%.
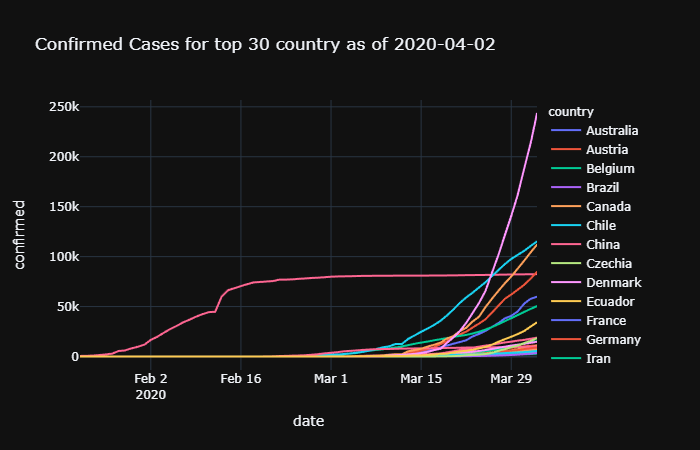
Let’s look at a list of the top 30 countries and their total confirmed cases and fatalities.

It seems that US, Italy, and Spain top the list with even Germany having more confirmed cases than China. Korea is also high relative to its population. I believe this is because Korea executes inspection aggressively.
We can see coronavirus hit China first, but its trend has gone down and flattened by March. Europe is hit by the second wave in March (Italy, Spain, Germany, France, UK). The third wave hits the US now, and the US has a higher growth rate than China or Europe. Its main spread starts from the ides of March and its speed is greater than that of Italy.
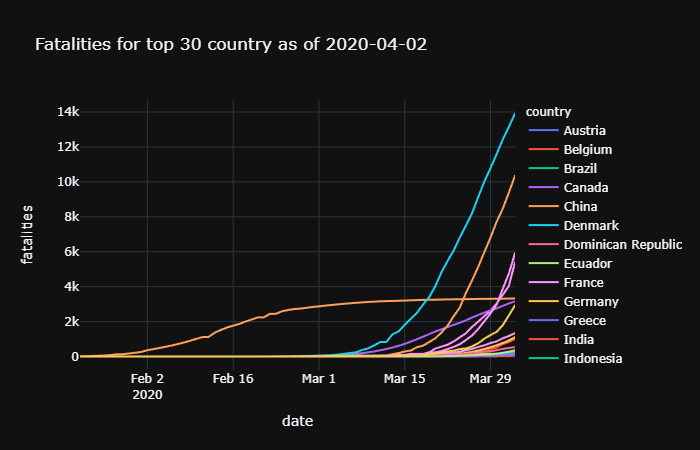
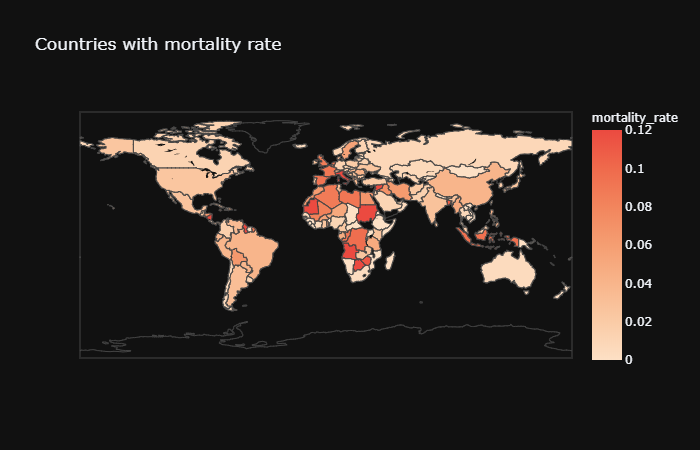
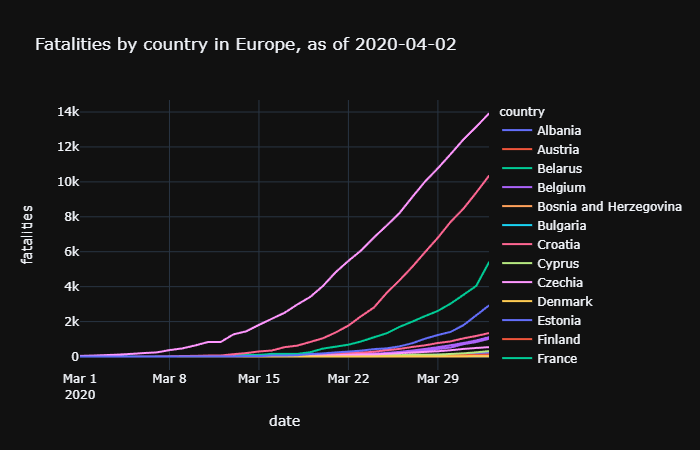
We see that in terms of fatalities, Europe is more serious than the US right now. Let’s look at mortality rate by country, top 30.
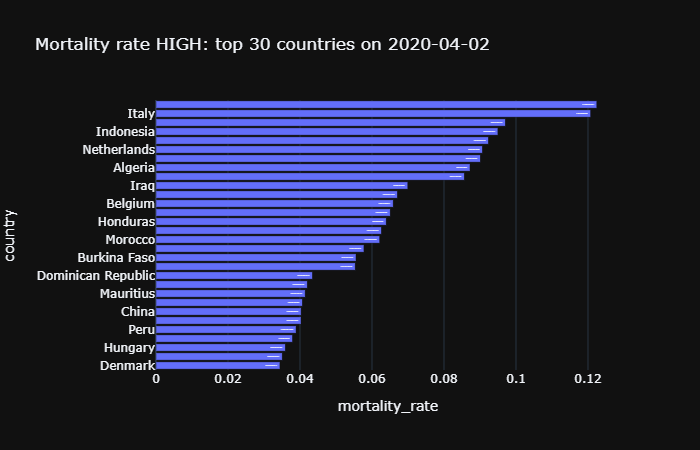
Italy’s mortality rate is at 12% as of 4/3/2020. Overall, the top 30 countries have at least a 3-12x higher rate of mortality than what we are lead to believe (the 0.01% number for major demographics).
Maybe we can look at countries whose mortality rates are low for insight. Though, many of these countries simply do not report/measure fatalities properly.
If we look at only “New” cases, we find the following trends: *China reached its peak in Feb 14, new confirmed cases for China is relatively low *Europe and US spread starts mid-March, after China slows down *Lock Down Policy in Europe (Italy, Spain, Germany, France) should now come into effect, seems that the number of new confirmed cases in Europe is not as high now as it was in mid-March *USA has the highes speed of new confirmed cases
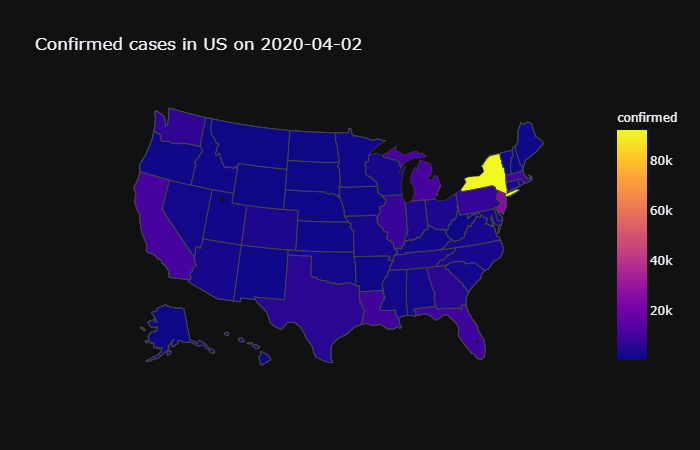
Clearly, NY has the highest rate. Let’s look at mortality rates.
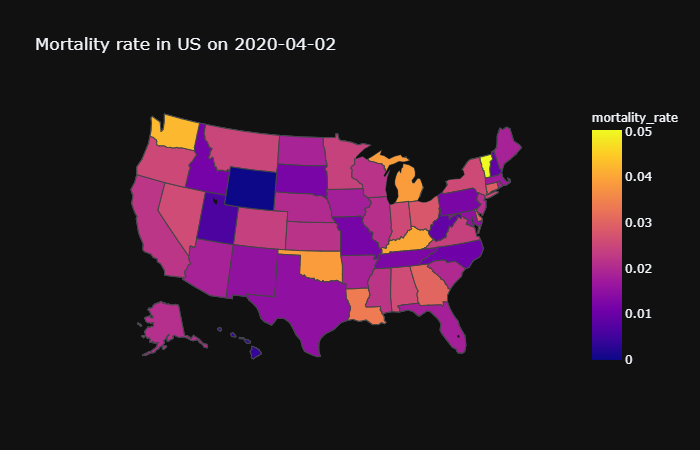
Not that high at about 2%. Let’s look at it by state.
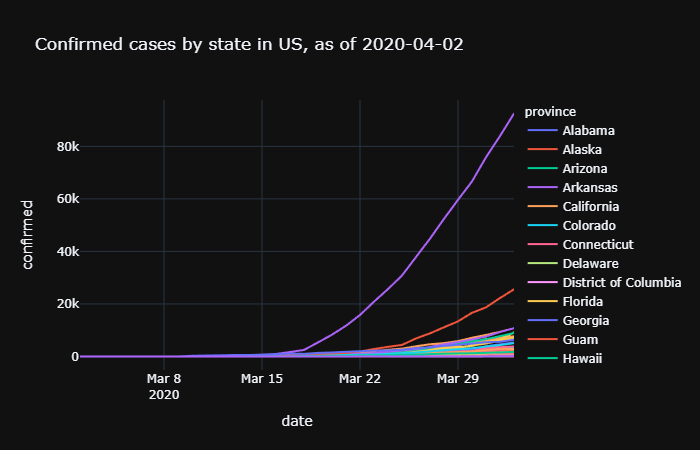
In NY, there’s <1000 confirmed cases on March 16th. In two weeks, March 30th, we have nearly 70,000 confirmed cases in NY.
Let’s look at Europe.
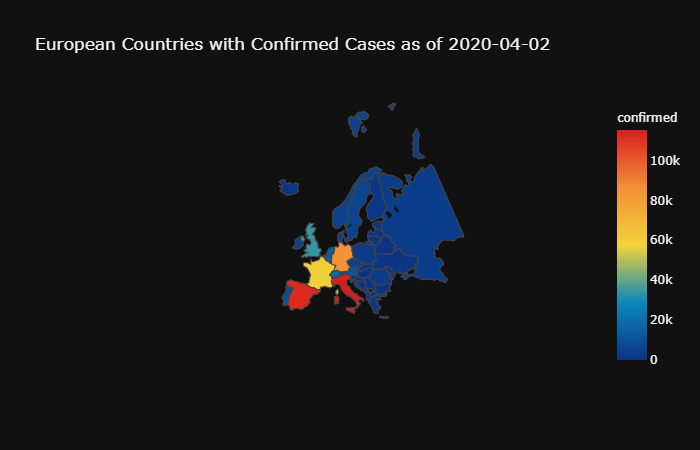
Seems that the Northern and Eastern regions are doing better than Western and Southern regions.
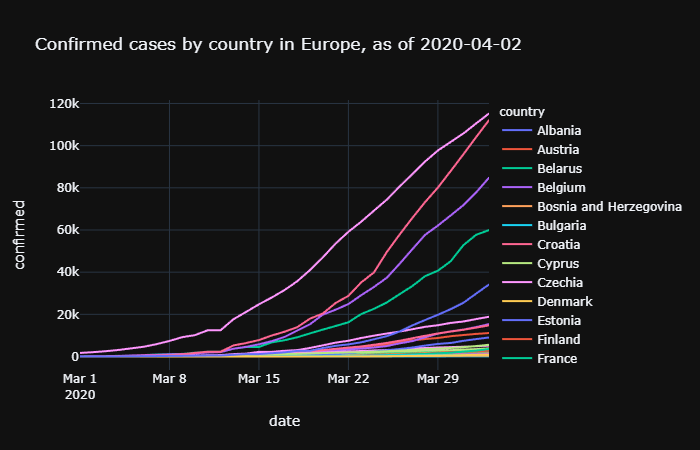
Italy, Spain, Germany, and France are experiencing the worst of it.
Spain, Germany, and France all show a daily growth that is more than that of Italy’s now. UK is also reaching a growth rate comparable to Italy. These 4 nations are potentially more dangerous than Italy. Italy’s rate of new cases has not been increasing since March 21st, most likely due to Lock-Down procedures.
Forecasting
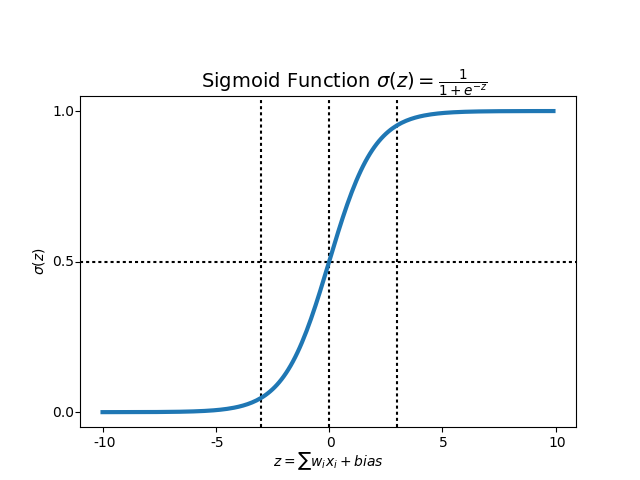
There’s a lot of different things that can be done in Machine Learning to forecast trends. Here’s my attempt at sigmoid fitting. Basically, with many natural processes in complex systems, you’ll see an exponential growth until an inflection point is reached at which the slope ceases to increase (growth rate) resulting in an overall flattened curve.
In Machine Learning, you basically have a set of inputs (x’s), each of which have certain weights (w’s), which are summed up to produce a single value which is adjusted for bias (depends on whatever data you’re working with), and is “activated” by an activation function, and then spit out as an output. Here’s a schematic of a single-layer perceptron.
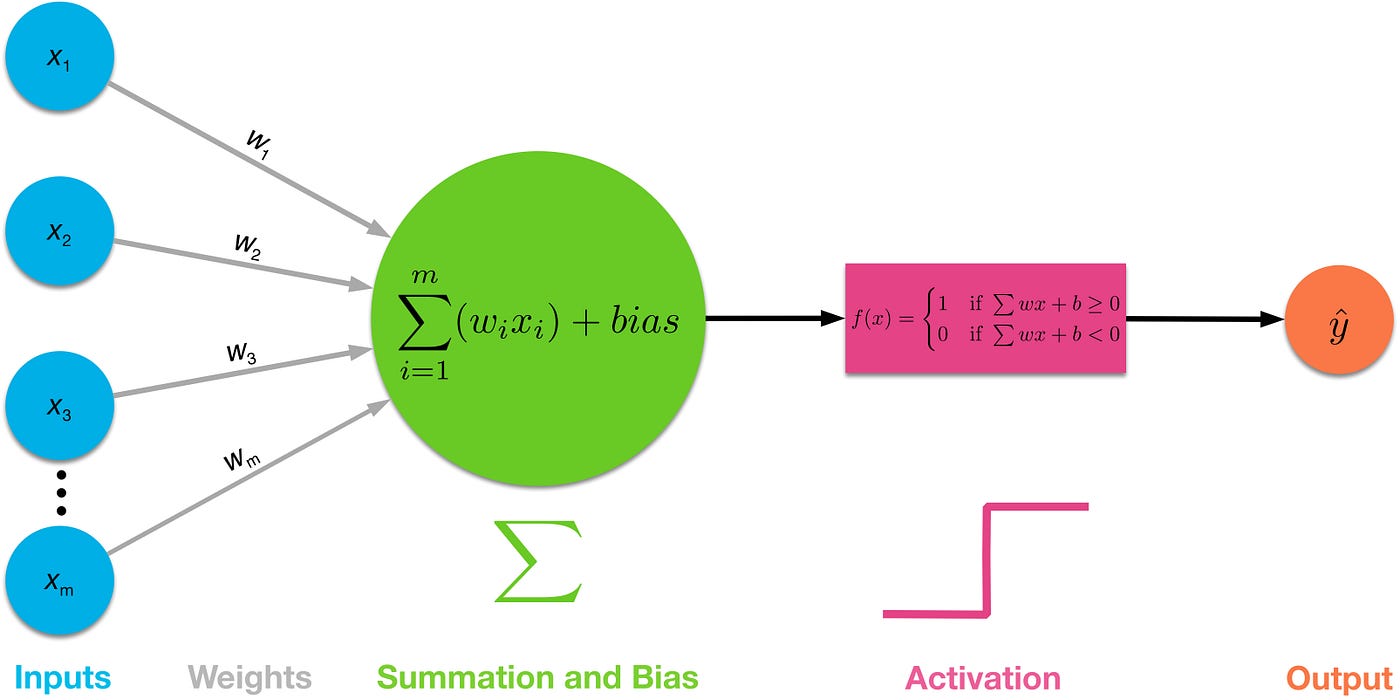
The activation function above is that for a step function. What this means is that the final output is a linear combination (sum of dot products) of the input data. The activation function above can only be 1 or 0, like this:
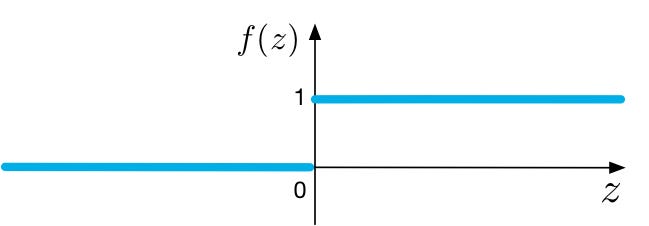
This is not only binary, but there is no slope (therefore, derivative), which means that minute changes in the input data do not translate to the overall plot of the curve. The purpose of Machine Learning is to produce learning algorithms improve our neural network by gradually changing (updating) the weights.

Another name for this is Logistic function. When you fit data with a logistic function, it’s called Logistic Regression.
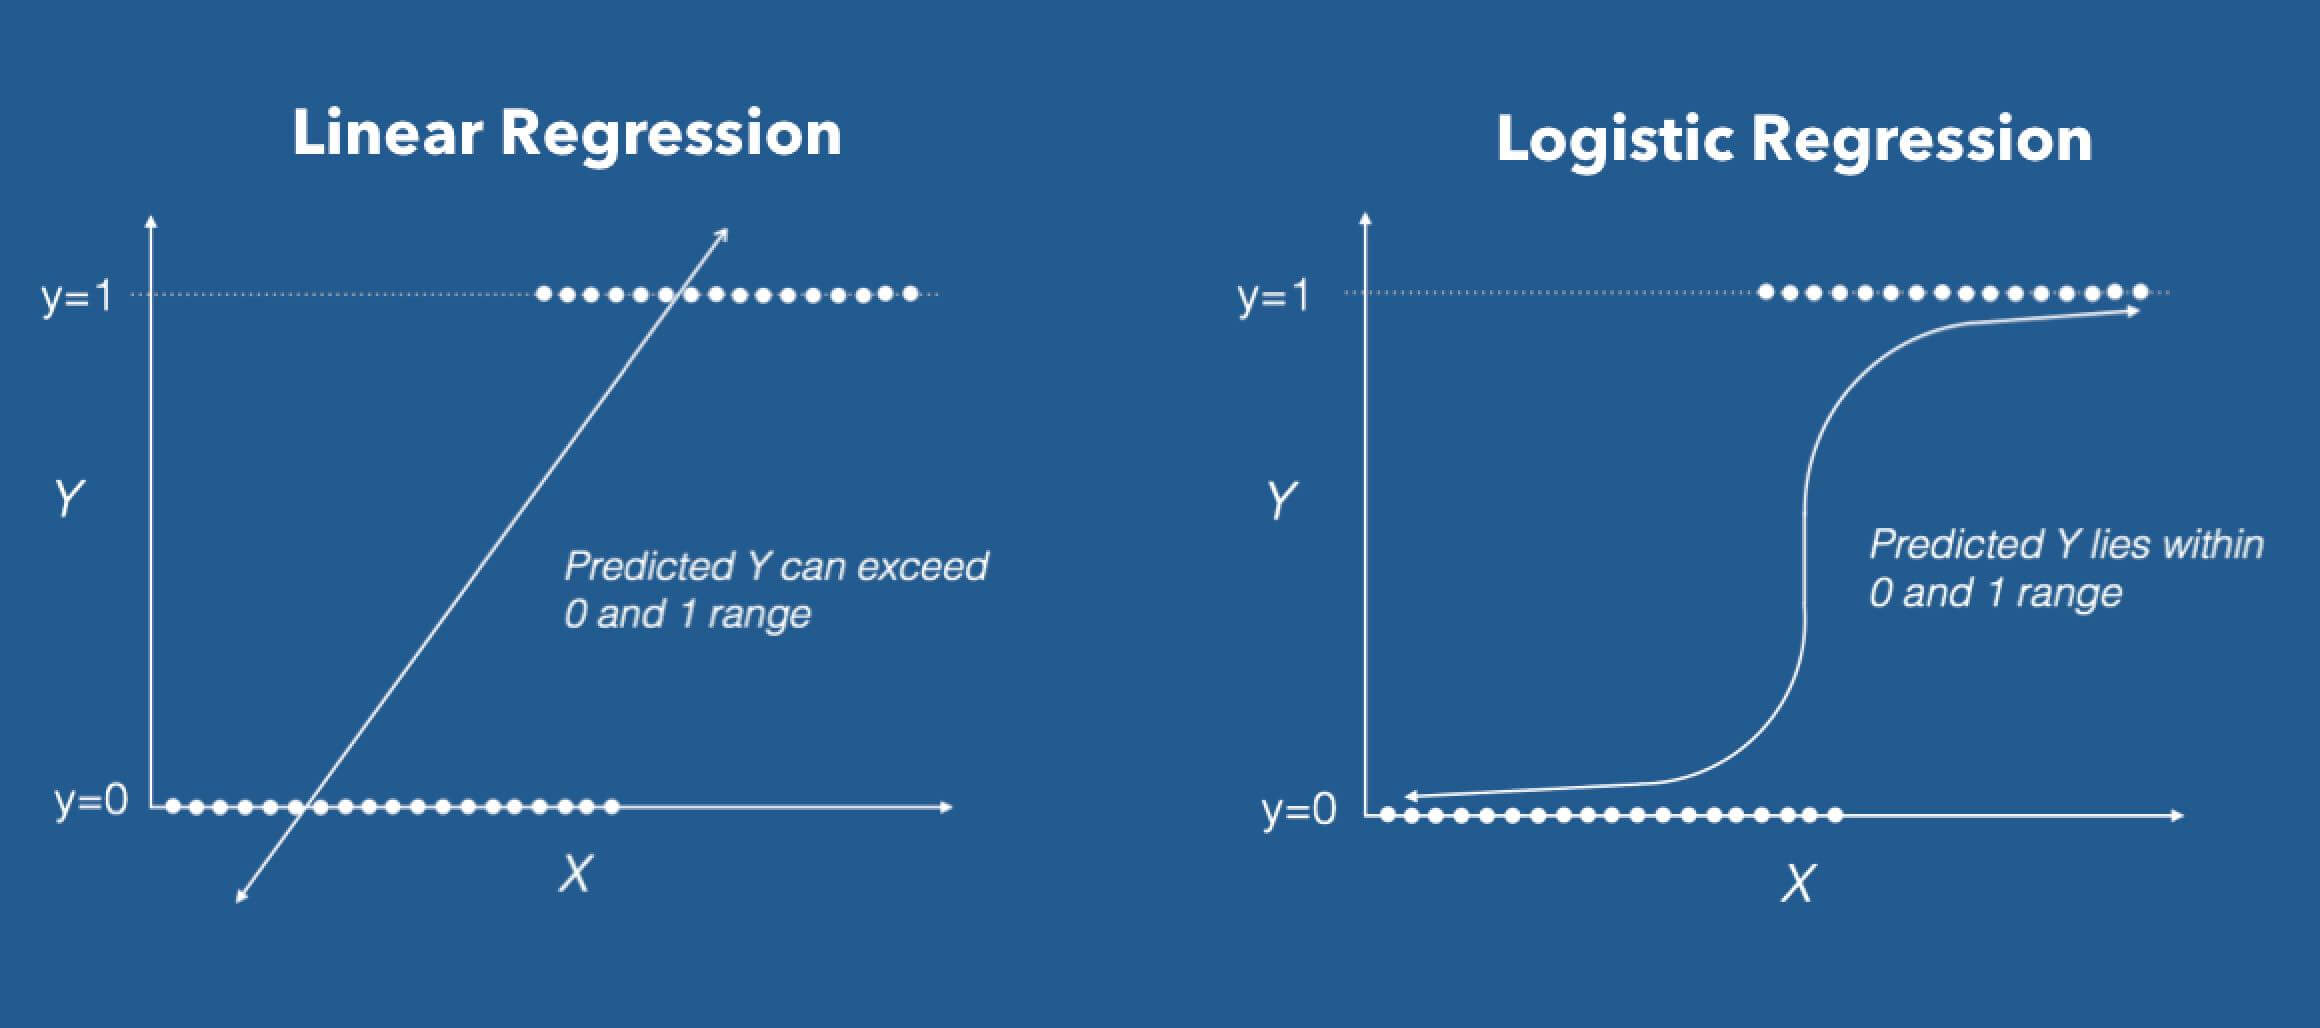
Without going too much into it, this non-linear activation function produces a new representation. This can get complicated, as it involves dimensionality changes which fall under the umbrella of Manifolds and Topology. But anyway, this is the result I get when sigmoid fitting.
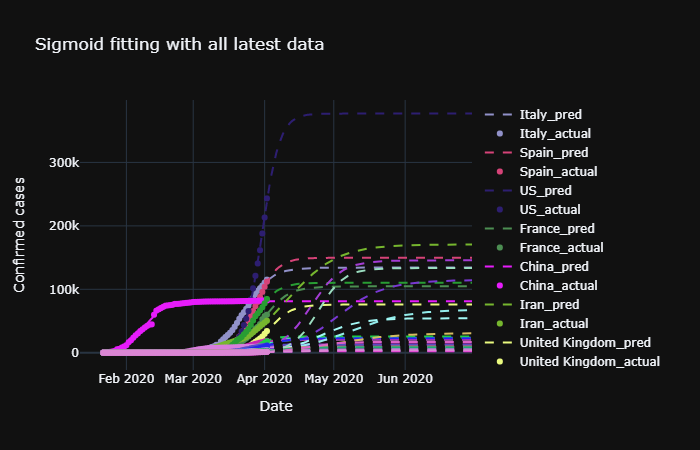
If this is accurate, confirmed cases in the US should slow down and converge around mid-April.
In some countries like Iran, Belgium, Sweden and Denmark, we can expect convergence at a later date like in May. To test the accuracy of this model, let’s try validating it by seeing what it would have predicted the rates for this week by removing data from the past 7 days.
It predicted for April 2nd, 2020 in the USA: 239,048 Total Cases. The actual result for that date is 243,295 cases. The model underestimates the actual result.
Code
– Code where the above images are from; 4/3/2020
Attempt to find correlations between Temperature and COVID-19; 3/23/2020