
SIR Model

The SIR Model is the most famous epidemiologic model. It considers the population that belongs to each of the following states:
- Susceptible (S) - the individual has not contracted the disease, but the individual can be infected due to transmission from infected people.
- Infected (I) - This person has contracted the disease.
- Recovered/Deceased (R) - This person either survived, hence recovered, or has died, hence deceased.
β is the parameter for transmission rate, and γ is the recovery rate. On the right, you have ordinary differential equations that summarize this model in a short-term deterministic model. This ignores vital dynamics (ie. new births, for a growing population) so it is a closed population.
The graph should make sense. Overtime, the number Susceptible (S) decreases, the number Recovered/Deceased (R) increases, and the number Infected (I) increases to a peak then drops back down.
I solve the differential equations using a 4th order Runge-Kutta method.
I decided to change my model to the superior SEIR Model:
SEIR Model
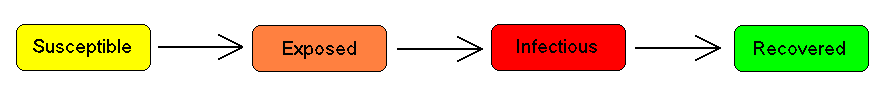
This has an “Exposed” compartment which is ideal for infections that have a significant incubation period during which individuals have been infected but are not yet infectious themselves.
α is the parameter for the average incubation, and μ is the death rate.
This is an excellent SEIR-model calculator for COVID
So to re-iterate:
- S ==> Susceptible : number of susceptible
- E ==> Expose : number of exposed
- I ==> Infectious : number of infectious
- R ==> Recovered or Removed : number recovered (or immune) individuals.
- We have S + E + I + R = N, this is only constant because of the (degenerate) assumption that birth and death rates are equal, N is country population.
There’s also a few other variables:
- R_0 & R_t ==> Reproduction number: The definition describes the state where no other individuals are infected or immunized (naturally or through vaccination)
- T_inf ==> Average duration of the infection, 1/T_inf can be treat as individual experiences one recovery in D units of time.
- T_inc ==> Average incubation period, Many paper and article define as 5.1 (reference, reference2)
The R_0 can decrease from intervention measures such as government isolation/lock-down, vaccinations, etc.
Here’s an example of the SEIR model on Hubei without intervention:
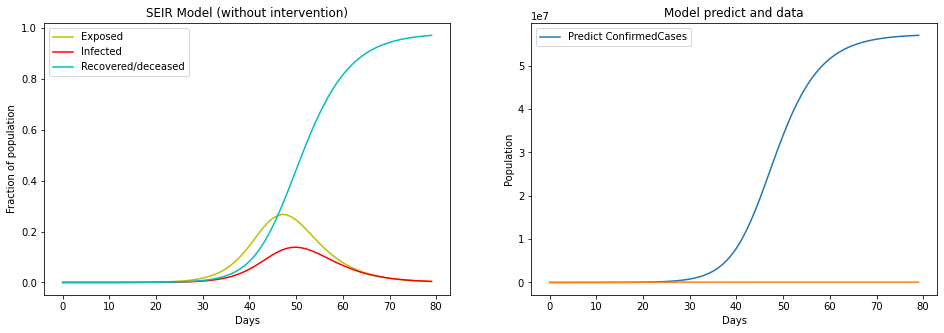
Now, with intervention:

A substantial difference as you can see.
In models with intervention, we can reduct R_t by using differential decay functions, like the Hill Function.

The Hill Function represents a half-decay that never reaches zero due to its exponential nature.
I find that the average incubation period (T_inc) is 5.2, and the average infectious period (T_inf) is 2.9.
As for R_t, I find this number by fitting the real data to the SEIR model’s curve. Same goes for cfr, or Case Fatality Rate.
Given that the Hill Function involves the R_0 to half each time, that is what I set as the function for the total period of time that intervention is enforced. I think 80 days is a good average.
So, once intervention begins, R0 = R0 * 0.5.
TL;DW (too long, didn’t write especially considering the hour) so I’m just going to link my code here it’s relatively self-explanatory.
Let’s just throw some relevant forecasting curves up first:
United States
.png)
New York
.png)
Global
.png)